Higher and Graduate Education: Census, ENADE, IDD, CPC, IGC, and CAPES
Source:vignettes/higher-education.Rmd
higher-education.RmdThis vignette covers higher education and graduate education datasets available in educabR. These datasets allow you to analyze institutions, courses, student performance, and quality indicators across Brazilian higher education.
Higher Education Census
The Higher Education Census is an annual survey covering all Brazilian higher education institutions (IES), including data on institutions, courses, student enrollment, and faculty.
Available data types
| Type | Description |
|---|---|
"ies" |
Institutions (location, administrative type, accreditation) |
"cursos" |
Undergraduate courses (area, modality, enrollment) |
"alunos" |
Student enrollment (demographics, enrollment status) |
"docentes" |
Faculty (qualifications, employment type) |
Downloading data
# Institution data
ies_2023 <- get_censo_superior(year = 2023, type = "ies")

# Course data filtered by state
cursos_sp <- get_censo_superior(year = 2023, type = "cursos", uf = "SP")

# Faculty data with limited rows
docentes_sample <- get_censo_superior(
  year  = 2023,
  type  = "docentes",
  n_max = 10000
)Exploring ZIP contents
# See what files are inside the downloaded ZIP
list_censo_superior_files(2023)
Example analysis: Institutions by administrative type
ies <- get_censo_superior(2023, type = "ies")

ies_summary <-
  ies |>
  mutate(
    admin_type = case_when(
      tp_categoria_administrativa == 1 ~ "Public Federal",
      tp_categoria_administrativa == 2 ~ "Public State",
      tp_categoria_administrativa == 3 ~ "Public Municipal",
      tp_categoria_administrativa == 4 ~ "Private For-Profit",
      tp_categoria_administrativa == 5 ~ "Private Non-Profit",
      TRUE ~ "Other"
    )
  ) |>
  count(admin_type, sort = TRUE)

ggplot(ies_summary, aes(x = reorder(admin_type, n), y = n)) +
  geom_col(fill = "steelblue") +
  coord_flip() +
  labs(
    title = "Higher Education Institutions by Type (2023)",
    x     = NULL,
    y     = "Number of Institutions"
  ) +
  theme_minimal() +
  scale_y_continuous(label = scales::number_format(big.mark = ".", decimal.mark = ","))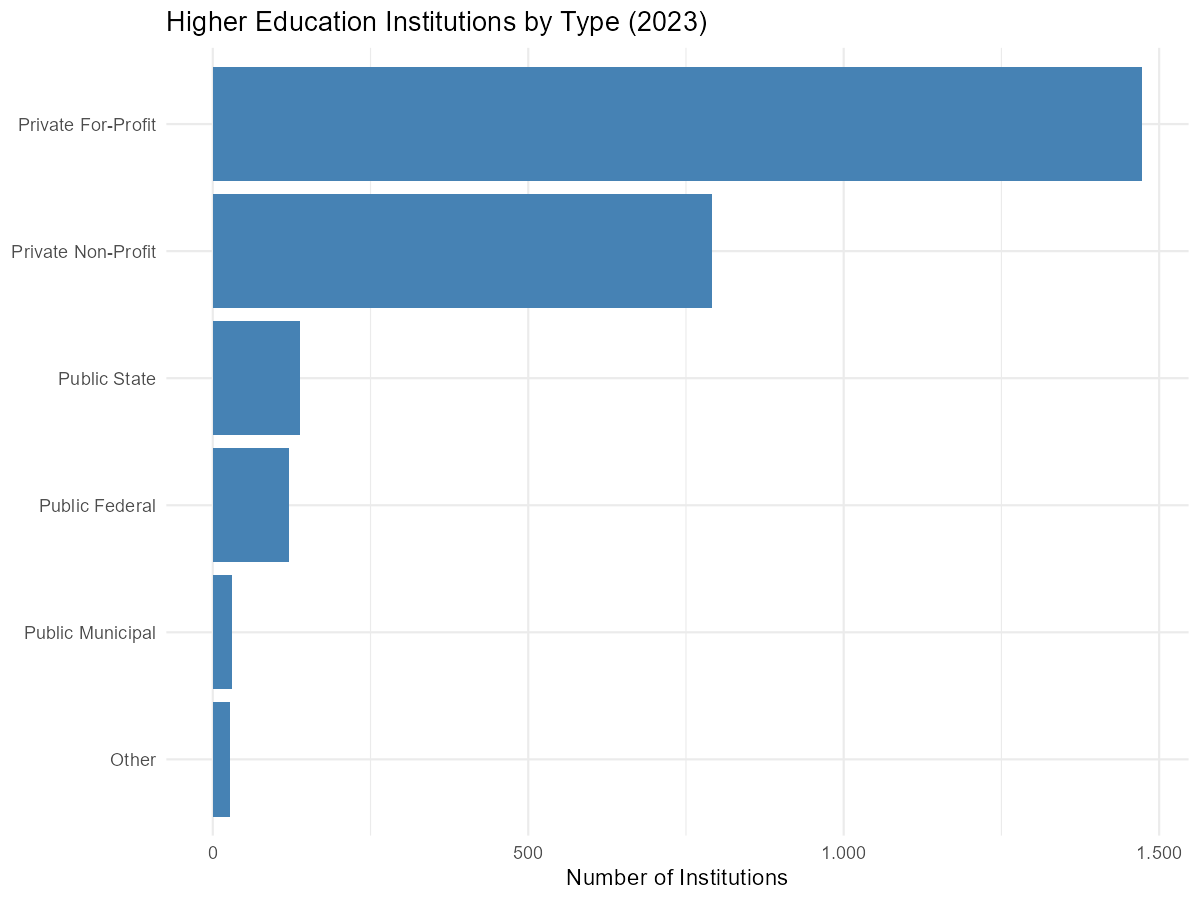
ENADE - National Student Performance Exam
ENADE (Exame Nacional de Desempenho dos Estudantes) is an annual exam assessing undergraduate student performance. It follows a rotating cycle where different course areas are evaluated each year.
Example analysis: Score distribution
enade <- get_enade(2023)

enade |>
  filter(!is.na(nt_ger)) |>
  ggplot(aes(x = nt_ger)) +
  geom_histogram(binwidth = 5, fill = "darkorange", color = "white") +
  labs(
    title = "ENADE 2023 - General Score Distribution",
    x     = "General Score (nt_ger)",
    y     = "Number of Students"
  ) +
  theme_minimal() +
  scale_y_continuous(label = scales::number_format(big.mark = ".", decimal.mark = ","))
IDD - Value-Added Indicator
IDD (Indicador de Diferenca entre os Desempenhos Observado e Esperado) measures the value added by an undergraduate course. It compares ENADE scores with the expected performance based on students’ ENEM admission scores.
CPC - Preliminary Course Concept
CPC (Conceito Preliminar de Curso) is a quality indicator for undergraduate courses. It combines ENADE scores, IDD, faculty qualifications, pedagogical resources, and student perceptions.
CPC scores range from 1 to 5, where courses scoring 1 or 2 are considered unsatisfactory.
Example analysis: Course quality distribution
cpc <- get_cpc(2023)

# Distribution of CPC scores
cpc |>
  filter(!is.na(cpc_faixa)) |>
  count(cpc_faixa) |>
  ggplot(aes(x = factor(cpc_faixa), y = n)) +
  geom_col(fill = "coral") +
  labs(
    title = "CPC 2023 - Course Quality Distribution",
    x     = "CPC Score (1-5)",
    y     = "Number of Courses"
  ) +
  theme_minimal() +
  scale_y_continuous(label = scales::number_format(big.mark = ".", decimal.mark = ","))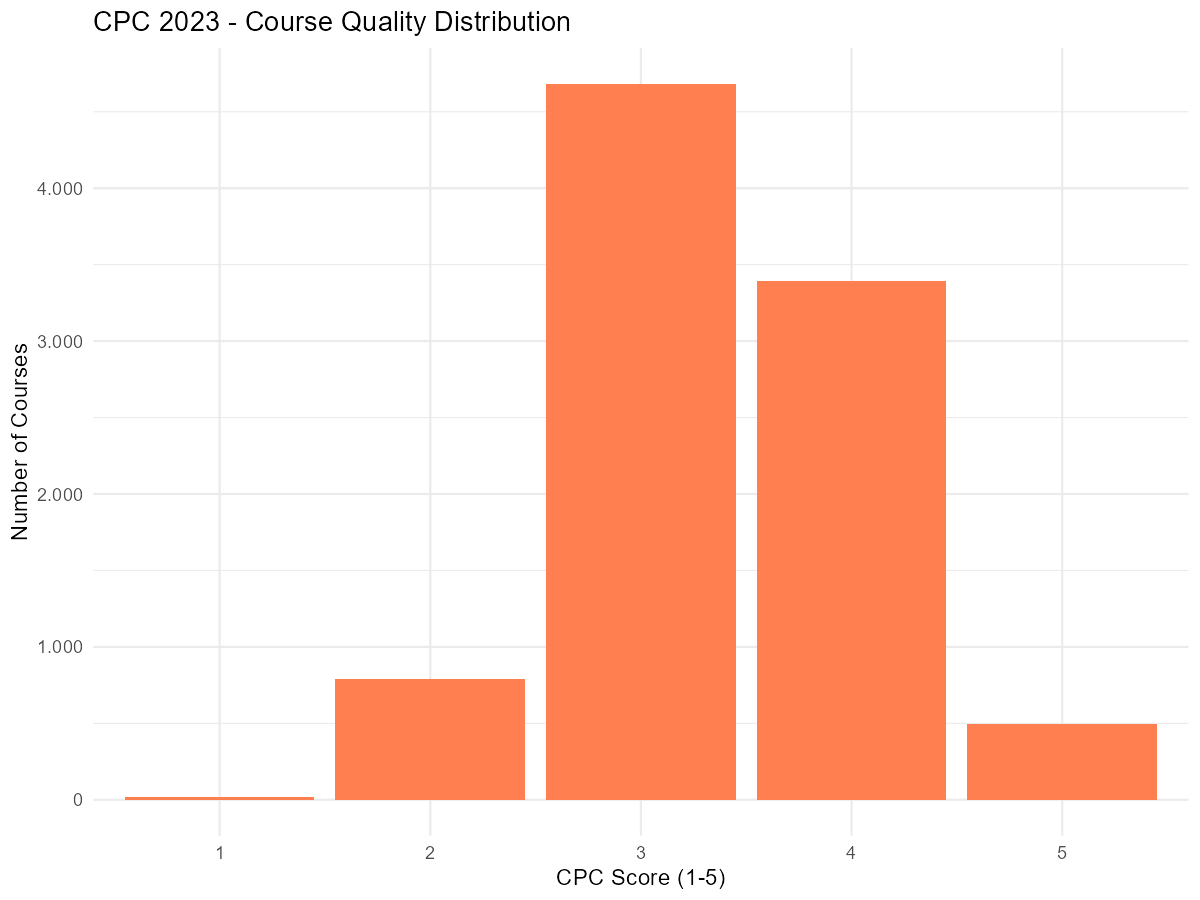
IGC - General Courses Index
IGC (Indice Geral de Cursos) is a quality indicator for higher education institutions. It is calculated as a weighted average of CPC scores for undergraduate courses plus CAPES scores for graduate programs.
IGC scores range from 1 to 5, providing an overall quality measure for each institution.
Available years
Data is available for 2007-2019 and 2021-2023 (no 2020 edition). Note: IGC 2007 comes as a 7z archive containing an Excel file.
Example analysis: Institution quality
igc <- get_igc(2023)

# Top institutions by continuous IGC
igc |>
  filter(!is.na(igc_continuo)) |>
  filter(!is.na(sigla_da_ies)) |>
  arrange(desc(igc_continuo)) |>
  head(20) |>
  ggplot(aes(x = reorder(sigla_da_ies, igc_continuo), y = igc_continuo)) +
  geom_col(fill = "darkblue") +
  coord_flip() +
  labs(
    title = "Top 20 Institutions by IGC (2023)",
    x     = NULL,
    y     = "IGC (Continuous)"
  ) +
  theme_minimal()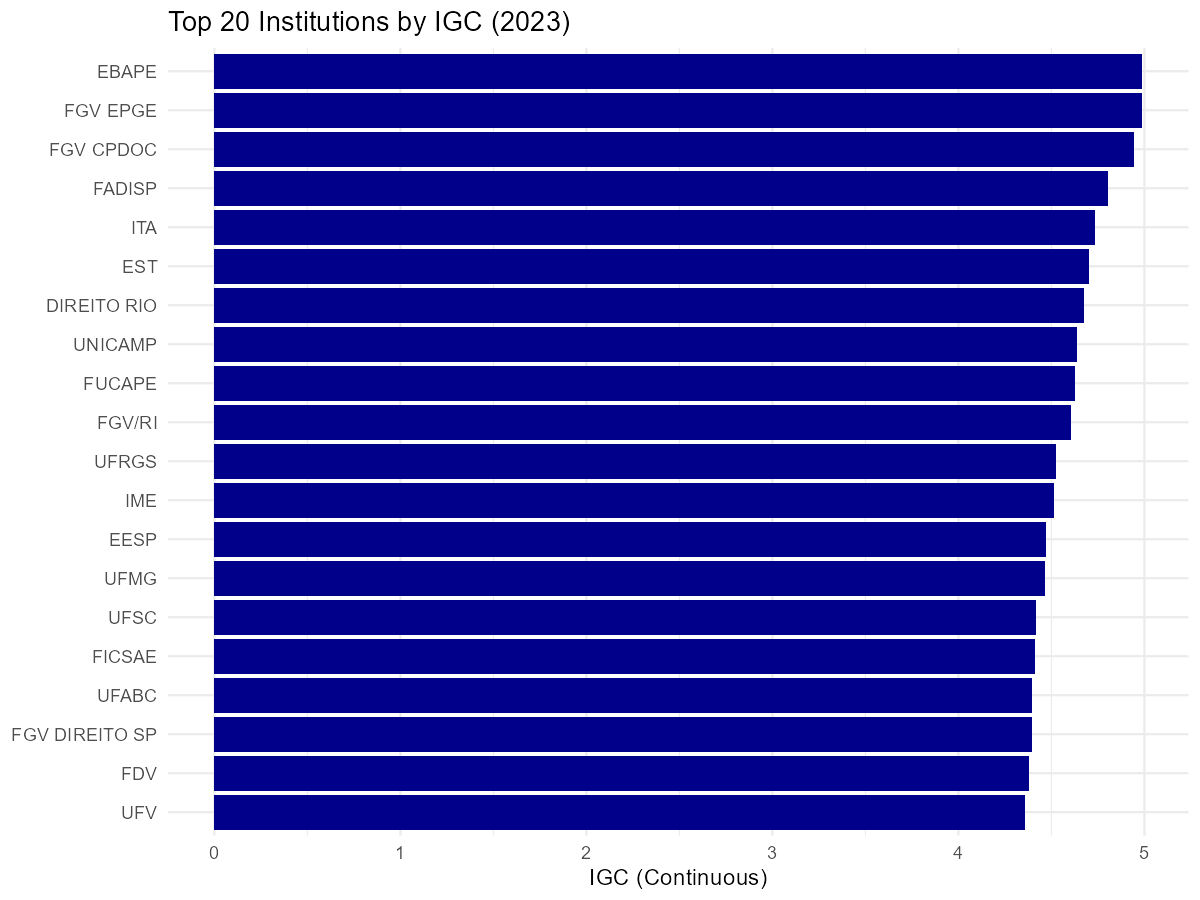
CAPES - Graduate Education Data
CAPES (Coordenacao de Aperfeicoamento de Pessoal de Nivel Superior) provides open data on Brazilian graduate programs (stricto sensu: masters and doctoral programs).
Available data types
| Type | Description |
|---|---|
"programas" |
Graduate programs (area, institution, CAPES score) |
"discentes" |
Students (enrollment, demographics, funding) |
"docentes" |
Faculty (qualifications, research output) |
"cursos" |
Graduate courses within programs |
"catalogo" |
Theses and dissertations catalog |
Available years
Data is available from 2013 to 2024. Data is retrieved from the CAPES Open Data Portal via CKAN API.
Example analysis: Graduate programs by knowledge area
programas <- get_capes(2023, type = "programas")

# Count programs by broad knowledge area
programas |>
  count(nm_grande_area_conhecimento, sort = TRUE) |>
  head(10) |>
  ggplot(aes(
    x = reorder(nm_grande_area_conhecimento, n),
    y = n
  )) +
  geom_col(fill = "purple4") +
  coord_flip() +
  labs(
    title = "Graduate Programs by Knowledge Area (2023)",
    x     = NULL,
    y     = "Number of Programs"
  ) +
  theme_minimal()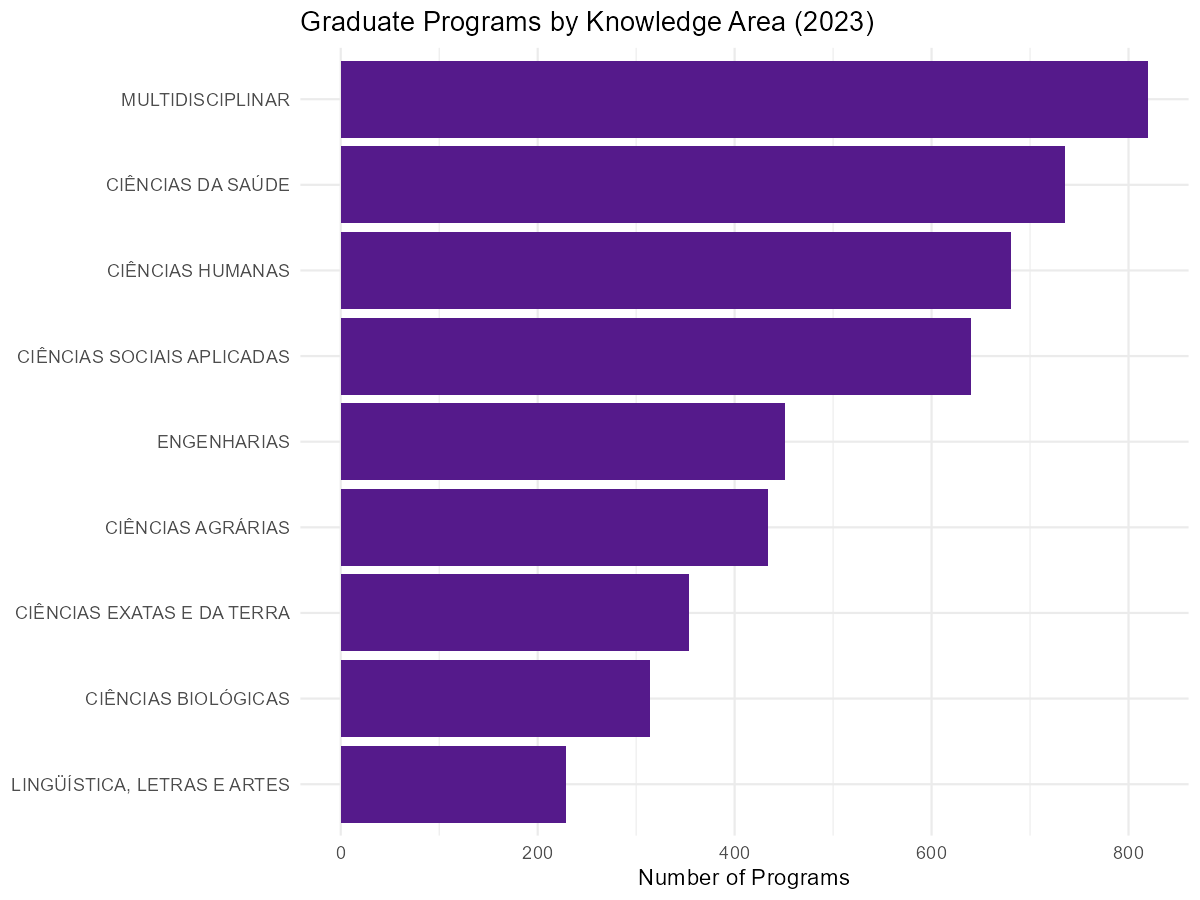
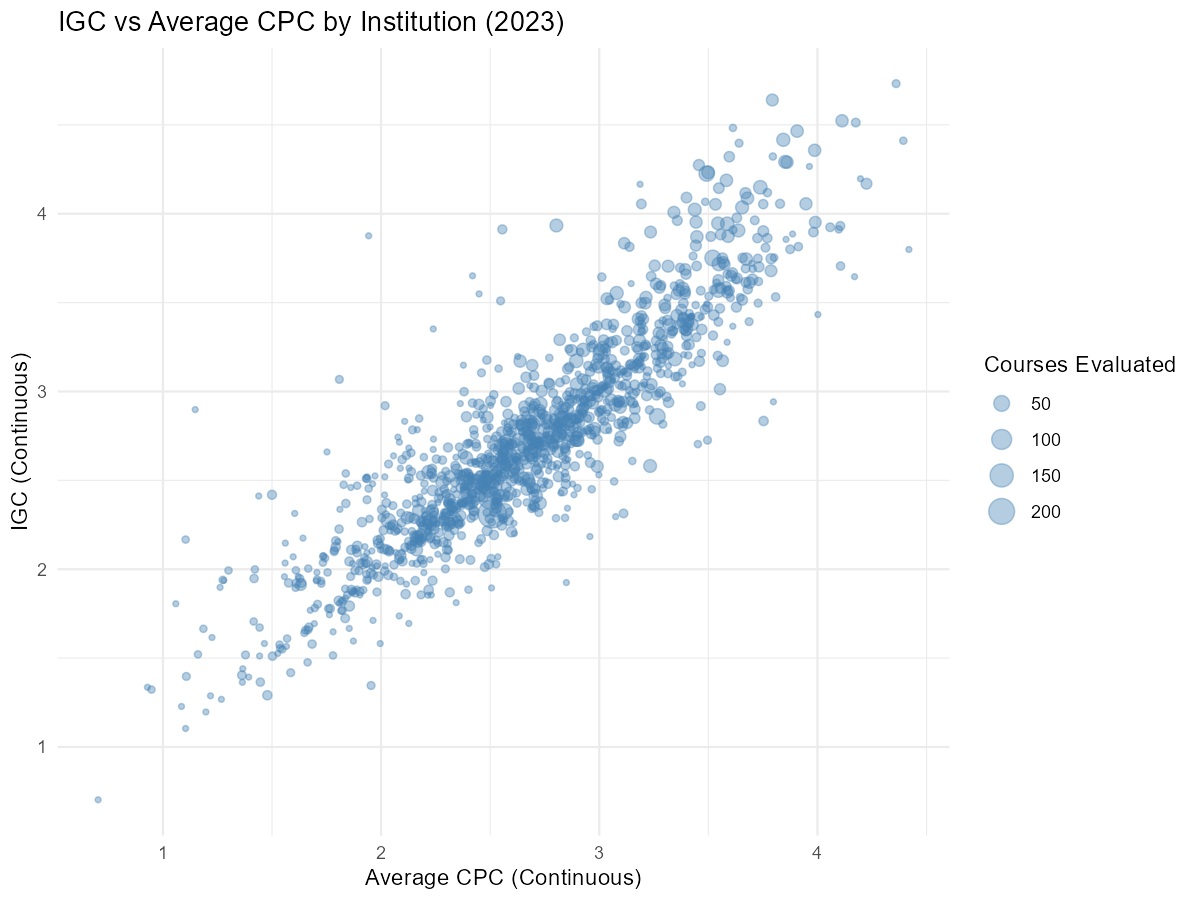
Combining quality indicators
CPC, IGC, IDD, and ENADE are closely related. Here is an example of how to combine them for a comprehensive view.
# Load CPC and IGC for the same year
cpc <- get_cpc(2023)
igc <- get_igc(2023)

# Compare institution-level quality
# IGC gives the overall institution score
# CPC gives individual course scores within each institution
igc_summary <-
  igc |>
  filter(!is.na(igc_faixa)) |>
  select(codigo_da_ies, sigla_da_ies, igc_continuo, igc_faixa)

cpc_summary <-
  cpc |>
  filter(!is.na(cpc_continuo)) |>
  group_by(codigo_da_ies) |>
  summarise(
    n_courses = n(),
    mean_cpc  = mean(cpc_continuo, na.rm = TRUE),
    .groups   = "drop"
  )

combined <- inner_join(igc_summary, cpc_summary, by = "codigo_da_ies")

ggplot(combined, aes(x = mean_cpc, y = igc_continuo, size = n_courses)) +
  geom_point(alpha = 0.4, color = "steelblue") +
  labs(
    title = "IGC vs Average CPC by Institution (2023)",
    x     = "Average CPC (Continuous)",
    y     = "IGC (Continuous)",
    size  = "Courses Evaluated"
  ) +
  theme_minimal()