Which municipalities improved the most in IDEB?
Source:vignettes/ideb-improvement-by-municipality.Rmd
ideb-improvement-by-municipality.RmdThis vignette shows how to use educabR to identify which
municipalities had the largest IDEB improvement over time, using the
historical series available via get_ideb().
Downloading IDEB data
get_ideb() returns data in long format with all
available editions. A single call with year = c(2005, 2023)
gives us the two endpoints we need for comparison.
ideb <- get_ideb(
  level  = "municipio",
  stage  = "anos_iniciais",
  metric = "indicador",
  year   = c(2005, 2023)
)
glimpse(ideb)
#> Rows: 86,982
#> Columns: 7
#> $ uf_sigla <chr> "RO", "RO", "RO", "RO", "RO", "RO", …
#> $ municipio_codigo <chr> "1100015", "1100015", "1100015", "1100…
#> $ municipio_nome <chr> "Alta Floresta D'Oeste", "Alta Florest…
#> $ rede <chr> "Estadual", "Municipal", "Pública", "E…
#> $ ano <int> 2005, 2005, 2005, 2005, 2005, 2005, 20…
#> $ indicador <chr> "IDEB", "IDEB", "IDEB", "IDEB", "IDEB…
#> $ valor <dbl> 3.5, NA, 3.7, 4.0, 3.5, 3.7, 4.1, 3.4…Calculating IDEB improvement
We filter to the IDEB indicator for municipal schools, pivot to wide format to get one column per year, then compute the change.
ideb_change <-
  ideb |>
  filter(indicador == "IDEB") |>
  filter(rede == "Municipal") |>
  select(uf_sigla, municipio_codigo, municipio_nome, ano, valor) |>
  pivot_wider(names_from = ano, values_from = valor, names_prefix = "ideb_") |>
  filter(!is.na(ideb_2005), !is.na(ideb_2023)) |>
  mutate(
    change     = ideb_2023 - ideb_2005,
    pct_change = change / ideb_2005 * 100
  )
Top 20 municipalities by absolute improvement
ideb_change |>
  slice_max(change, n = 20) |>
  ggplot(aes(
    x = reorder(paste(municipio_nome, uf_sigla, sep = " - "), change),
    y = change
  )) +
  geom_col(fill = "#2a9d8f") +
  coord_flip() +
  labs(
    title    = "Top 20 Municipalities by IDEB Improvement (2005-2023)",
    subtitle = "Municipal schools, early elementary (1st-5th grade)",
    x        = NULL,
    y        = "IDEB change (2023 - 2005)"
  ) +
  theme_minimal()
Distribution of improvement by state
ideb_change |>
  ggplot(aes(x = reorder(uf_sigla, change, FUN = median), y = change)) +
  geom_boxplot(fill = "#2a9d8f", alpha = 0.6, outlier.size = 0.5) +
  coord_flip() +
  labs(
    title    = "IDEB Improvement Distribution by State (2005-2023)",
    subtitle = "Municipal schools, early elementary (1st-5th grade)",
    x        = NULL,
    y        = "IDEB change"
  ) +
  theme_minimal()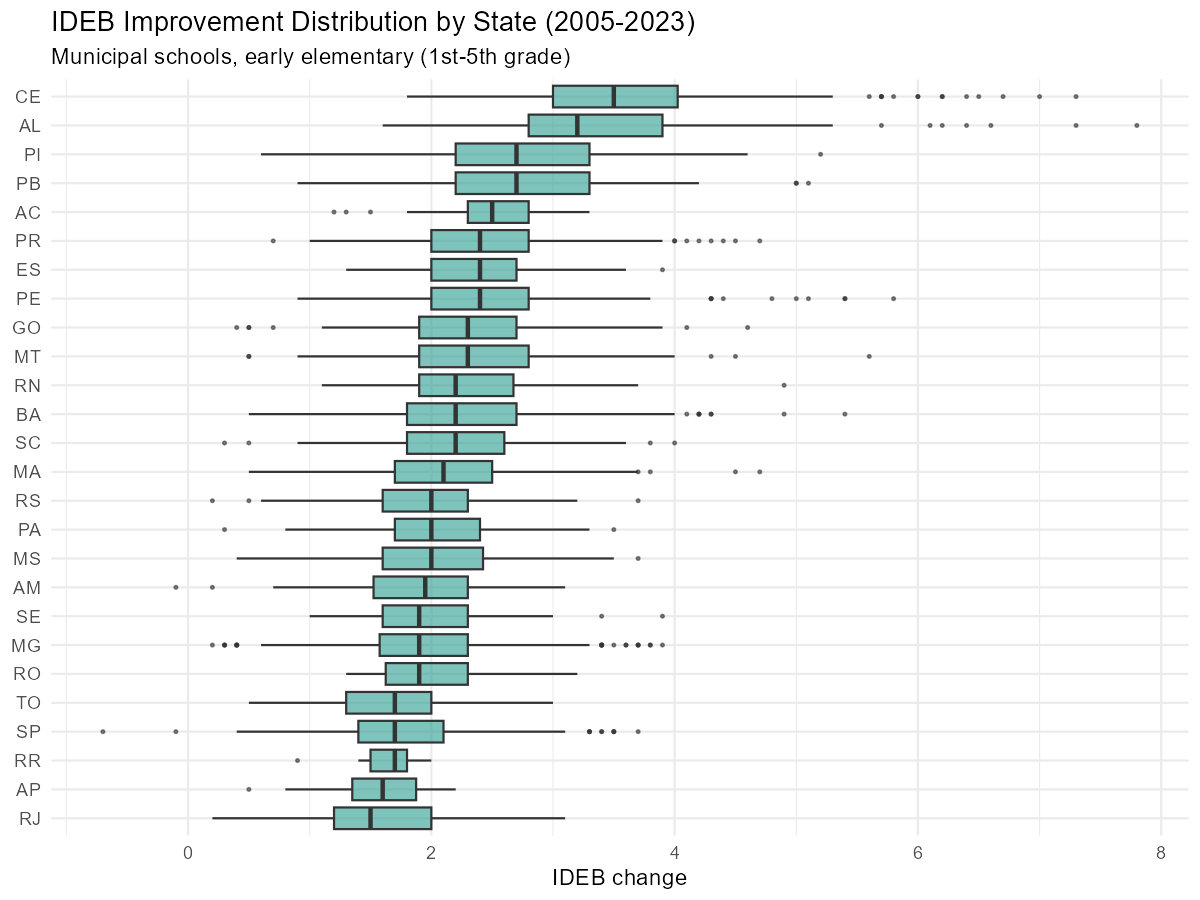
IDEB trajectory for selected municipalities
# Pick the top 5 improvers
top5 <-
  ideb_change |>
  filter(rede == "Municipal") |>
  slice_max(change, n = 5) |>
  pull(municipio_codigo)

# Get full history for these municipalities
ideb_full <-
  get_ideb(
    level  = "municipio",
    stage  = "anos_iniciais",
    metric = "indicador"
  ) |>
  filter(rede == "Municipal")

ideb_full |>
  filter(municipio_codigo %in% top5, indicador == "IDEB") |>
  mutate(label = paste(municipio_nome, uf_sigla, sep = " - ")) |>
  ggplot(aes(x = factor(ano), y = valor, color = label, group = label)) +
  geom_line(linewidth = 1) +
  geom_point(size = 2) +
  labs(
    title    = "IDEB Trajectory - Top 5 Improvers",
    subtitle = "Municipal schools, early elementary (1st-5th grade)",
    x        = "Year",
    y     = "IDEB",
    color = NULL
  ) +
  theme_minimal() +
  theme(legend.position = "bottom")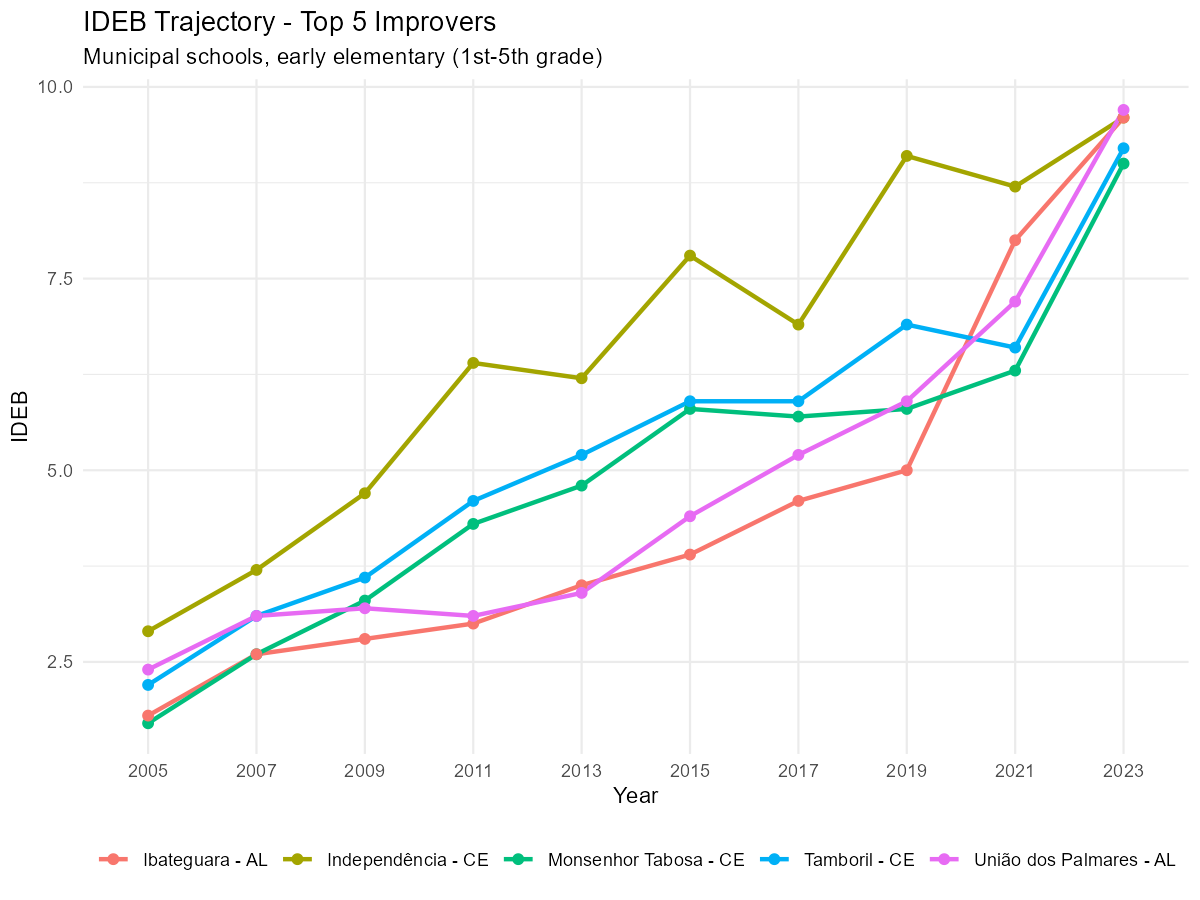
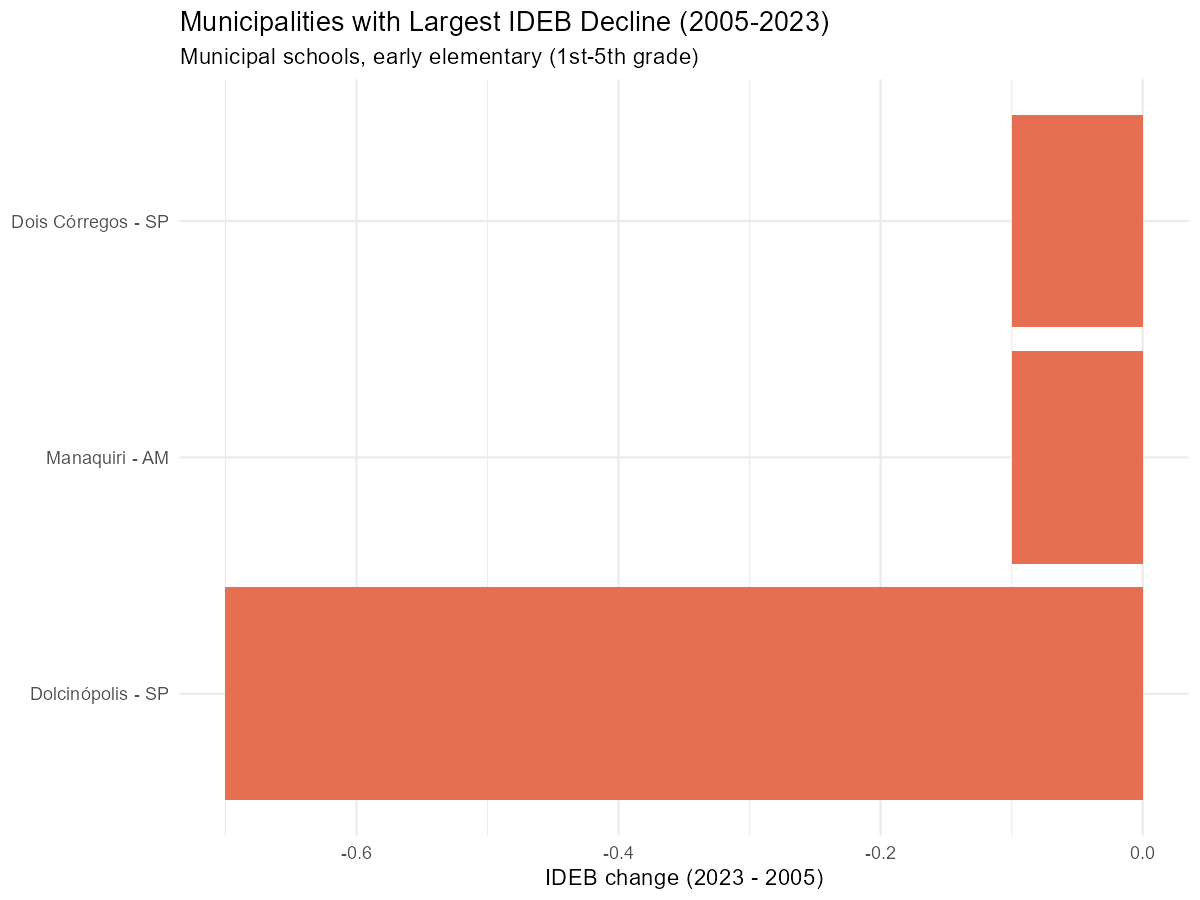
Municipalities that declined
ideb_change |>
  filter(change < 0) |>
  slice_min(change, n = 15) |>
  ggplot(aes(
    x = reorder(paste(municipio_nome, uf_sigla, sep = " - "), change),
    y = change
  )) +
  geom_col(fill = "#e76f51") +
  coord_flip() +
  labs(
    title    = "Municipalities with Largest IDEB Decline (2005-2023)",
    subtitle = "Municipal schools, early elementary (1st-5th grade)",
    x        = NULL,
    y        = "IDEB change (2023 - 2005)"
  ) +
  theme_minimal()