The educabR package provides easy access to Brazilian public education data from INEP, FNDE, and CAPES. With simple functions, you can download and process data from 14 datasets:
Basic Education:
- IDEB - Basic Education Development Index
- ENEM - National High School Exam
- School Census
- SAEB - Basic Education Assessment System
- ENCCEJA - Youth and Adult Education Certification
Exam
- ENEM by School - ENEM results aggregated by school
(2005-2015)
Higher Education:
- Higher Education Census
- ENADE - National Student Performance Exam
- IDD - Value-Added Indicator
- CPC - Preliminary Course Concept
- IGC - General Courses Index
Graduate Education:
- CAPES - Graduate programs, students, faculty,
courses, and theses
Education Funding:
- FUNDEB - Resource distribution and enrollment
data
This vignette covers IDEB, ENEM, and the School Census. For other
datasets, see:
- vignette("basic-education-assessments") — SAEB, ENCCEJA,
ENEM by School
- vignette("higher-education") — Higher Education Census,
ENADE, IDD, CPC, IGC, CAPES
- vignette("education-funding") — FUNDEB
Installation
# Install from GitHub (development version)
# install.packages("remotes")
remotes::install_github("SidneyBissoli/educabR")Configuring Cache
educabR caches downloaded files to avoid repeated downloads. By default, it uses a temporary directory. To persist data across sessions:
# Check current cache directory
get_cache_dir()

# Set a permanent directory
set_cache_dir("~/educabR_data")

# List cached files
list_cache()

# Clear cache (when needed)
clear_cache()
IDEB - Basic Education Development Index
IDEB is the main indicator of basic education quality in Brazil, combining test performance (SAEB) with grade promotion rates.
Available years and levels
# See available combinations
list_ideb_available()| Level | Stage | Metric |
|---|---|---|
| brasil | anos_finais | aprovacao |
| brasil | anos_finais | indicador |
| brasil | anos_finais | meta |
| brasil | anos_finais | nota |
| brasil | anos_iniciais | aprovacao |
| brasil | anos_iniciais | indicador |
| brasil | anos_iniciais | meta |
| brasil | anos_iniciais | nota |
| brasil | ensino_medio | aprovacao |
| brasil | ensino_medio | indicador |
| Showing 10 of 60 available combinations |
Downloading IDEB data
# IDEB by school - Early elementary (1st-5th grade)
ideb_schools <- get_ideb(
  level  = "escola",
  stage  = "anos_iniciais",
  metric = "indicador",
  year   = 2021
)

# IDEB by municipality - High school (1st-4th grade)
ideb_municipalities <- get_ideb(
  level  = "municipio",
  stage  = "ensino_medio",
  metric = "indicador",
  year   = 2023
)

# Filter by state after downloading
ideb_sp <-
  ideb_schools |>
  dplyr::filter(uf_sigla == "SP")
Data structure
# View structure
glimpse(ideb_schools)
#> Rows: 194,715
#> Columns: 9
#> $ uf_sigla         <chr> "RO", "RO", "RO", ...
#> $ municipio_codigo <chr> "1100015", "1100015", ...
#> $ municipio_nome   <chr> "Alta Floresta D'Oeste", ...
#> $ escola_id        <chr> "11024372", "11024666", ...
#> $ escola_nome      <chr> "EMEIEF ANA NERY", "EMEIEF BOA ESPERANCA", ...
#> $ rede             <chr> "Municipal", "Municipal", ...
#> $ ano              <int> 2021, 2021, ...
#> $ indicador        <chr> "IDEB", "IDEB", ...
#> $ valor            <dbl> NA, NA, 5.9, 4.1, ...
Example analysis: Average IDEB by state
# Calculate average IDEB by state (observed indicator only)
ideb_by_state <-
  ideb_schools |>
  filter(indicador == "IDEB", !is.na(valor)) |>
  group_by(uf_sigla) |>
  summarise(
    n_schools   = n(),
    mean_ideb   = mean(valor, na.rm = TRUE),
    median_ideb = median(valor, na.rm = TRUE)
  ) |>
  arrange(desc(mean_ideb))

# Plot
ggplot(ideb_by_state, aes(x = reorder(uf_sigla, mean_ideb), y = mean_ideb)) +
  geom_col(fill = "steelblue") +
  coord_flip() +
  labs(
    title = "Average IDEB by State - Early Elementary (2021)",
    x     = "State",
    y     = "Average IDEB"
  ) +
  theme_minimal()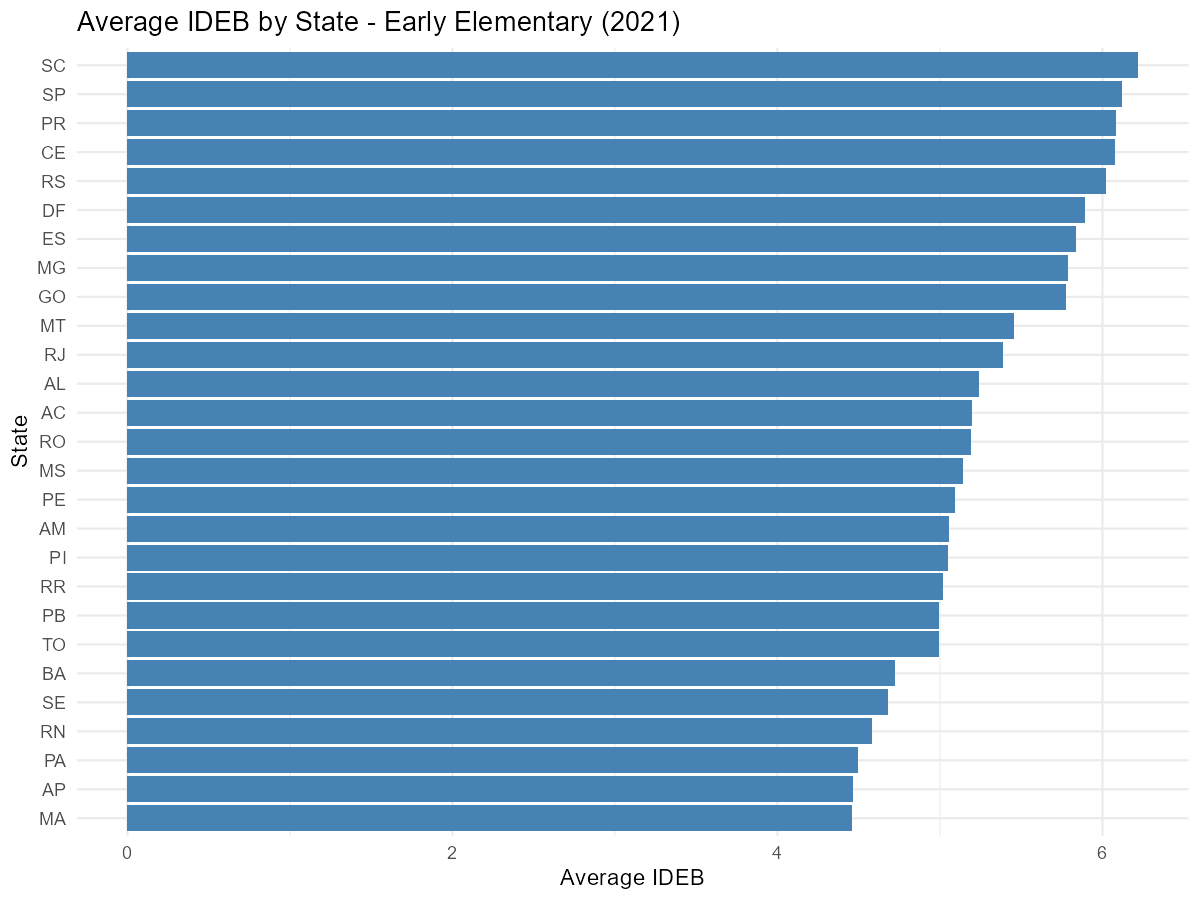
IDEB historical series
# Download historical series (get_ideb() already returns long format)
ideb_history <- get_ideb(
  level  = "municipio",
  stage  = "anos_iniciais",
  metric = "indicador",
  year   = c(2017, 2019, 2021, 2023)
)

# National trend
trend <-
  ideb_history |>
  filter(indicador == "IDEB") |>
  group_by(ano) |>
  summarise(mean_ideb = mean(valor, na.rm = TRUE))

ggplot(trend, aes(x = factor(ano), y = mean_ideb)) +
  geom_col(fill = "darkgreen", width = 0.6) +
  geom_text(
    aes(label = sprintf("%.2f", mean_ideb)),
    vjust = -0.5, size = 3.5
  ) +
  labs(
    title = "IDEB Trend - Early Elementary",
    x     = "Year",
    y     = "National Average IDEB"
  ) +
  theme_minimal() +
  scale_y_continuous(expand = expansion(mult = c(0, 0.1)))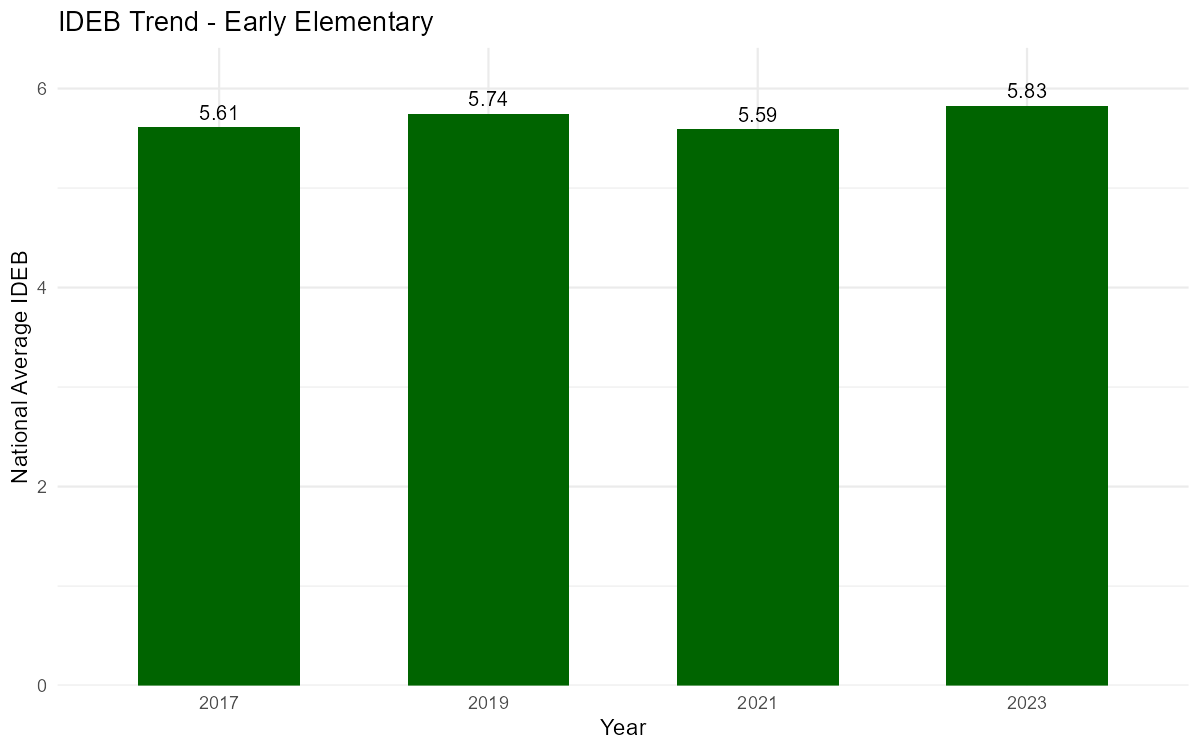
ENEM - National High School Exam
ENEM is Brazil’s largest exam, with millions of participants annually. The microdata includes demographics, socioeconomic data, and scores.
Downloading ENEM data
# WARNING: Large files (1-3 GB)!
# Use n_max for initial exploration

# Sample for exploration
enem_sample <- get_enem(2023, n_max = 10000)

# Full data (takes a while!)
# enem_full <- get_enem(2023)
Data structure
glimpse(enem_sample)
#> Rows: 10,000
#> Columns: 76
#> $ nu_inscricao           <dbl> 210059085136, 210059527735, ...
#> $ nu_ano                 <dbl> 2023, 2023, ...
#> $ tp_faixa_etaria        <dbl> 14, 12, 6, ...
#> $ tp_sexo                <chr> "M", "M", "F", ...
#> $ tp_estado_civil        <dbl> 2, 2, 1, ...
#> $ tp_cor_raca            <dbl> 1, 1, 1, ...
#> $ sg_uf_prova            <chr> "DF", "DF", "RS", ...
#> $ nu_nota_cn             <dbl> NA, NA, 502.0, ...
#> $ nu_nota_ch             <dbl> NA, NA, 498.9, ...
#> $ nu_nota_lc             <dbl> NA, NA, 475.6, ...
#> $ nu_nota_mt             <dbl> NA, NA, 363.2, ...
#> $ nu_nota_redacao        <dbl> NA, NA, 700, ...
#> # ... 64 more variables
Performance analysis
# Summary statistics for scores
enem_summary(enem_sample)| Variable | n | n_valid | Mean | SD | Min | Q25 | Median | Q75 | Max |
|---|---|---|---|---|---|---|---|---|---|
| nu_nota_cn | 10000 | 7281 | 492 | 79.8 | 0 | 440 | 489 | 541 | 817 |
| nu_nota_ch | 10000 | 7562 | 529 | 81.7 | 0 | 480 | 535 | 584 | 823 |
| nu_nota_lc | 10000 | 7562 | 520 | 70.4 | 0 | 476 | 524 | 568 | 731 |
| nu_nota_mt | 10000 | 7281 | 520 | 121.0 | 0 | 426 | 507 | 608 | 945 |
| nu_nota_comp1 | 10000 | 7562 | 126 | 32.1 | 0 | 120 | 120 | 160 | 200 |
| nu_nota_comp2 | 10000 | 7562 | 147 | 48.4 | 0 | 120 | 160 | 200 | 200 |
| nu_nota_comp3 | 10000 | 7562 | 124 | 41.0 | 0 | 100 | 120 | 160 | 200 |
| nu_nota_comp4 | 10000 | 7562 | 136 | 41.2 | 0 | 120 | 120 | 160 | 200 |
| nu_nota_comp5 | 10000 | 7562 | 117 | 60.0 | 0 | 80 | 120 | 160 | 200 |
| nu_nota_redacao | 10000 | 7562 | 649 | 201.0 | 0 | 520 | 640 | 820 | 980 |
| Based on a random sample of 10,000 observations |
# Summary by sex
enem_summary(enem_sample, by = "tp_sexo")| Sex | Variable | n | n_valid | Mean | SD | Min | Q25 | Median | Q75 | Max |
|---|---|---|---|---|---|---|---|---|---|---|
| F | nu_nota_cn | 7042 | 5130 | 485 | 76.5 | 0 | 435 | 481 | 532 | 817 |
| M | nu_nota_cn | 2958 | 2151 | 507 | 85.1 | 0 | 455 | 508 | 560 | 804 |
| F | nu_nota_ch | 7042 | 5328 | 527 | 78.6 | 0 | 480 | 532 | 579 | 784 |
| M | nu_nota_ch | 2958 | 2234 | 535 | 88.2 | 0 | 483 | 542 | 596 | 823 |
| F | nu_nota_lc | 7042 | 5328 | 520 | 68.2 | 0 | 476 | 523 | 566 | 731 |
| M | nu_nota_lc | 2958 | 2234 | 522 | 75.5 | 0 | 478 | 527 | 574 | 729 |
| F | nu_nota_mt | 7042 | 5130 | 509 | 116.0 | 0 | 420 | 494 | 589 | 944 |
| M | nu_nota_mt | 2958 | 2151 | 547 | 129.0 | 0 | 447 | 540 | 643 | 945 |
| F | nu_nota_comp1 | 7042 | 5328 | 128 | 30.8 | 0 | 120 | 120 | 160 | 200 |
| M | nu_nota_comp1 | 2958 | 2234 | 121 | 34.6 | 0 | 100 | 120 | 140 | 200 |
| Showing 10 of 20 rows |
# Average scores by race/ethnicity
scores_by_race <-
  enem_sample |>
  filter(!is.na(nu_nota_mt)) |>
  mutate(
    race = case_when(
      tp_cor_raca == 0 ~ "Not declared",
      tp_cor_raca == 1 ~ "White",
      tp_cor_raca == 2 ~ "Black",
      tp_cor_raca == 3 ~ "Mixed race",
      tp_cor_raca == 4 ~ "Asian",
      tp_cor_raca == 5 ~ "Indigenous"
    )
  ) |>
  group_by(race) |>
  summarise(
    n          = n(),
    mean_math  = mean(nu_nota_mt, na.rm = TRUE),
    mean_essay = mean(nu_nota_redacao, na.rm = TRUE)
)| Race | n | Mean Math | Mean Essay |
|---|---|---|---|
| Asian | 116 | 511 | 660 |
| Black | 1066 | 491 | 619 |
| Indigenous | 30 | 479 | 550 |
| Mixed race | 3383 | 507 | 643 |
| Not declared | 74 | 533 | 643 |
| White | 2612 | 550 | 690 |
| Based on a random sample of 10,000 observations |
Item response data
# Data about exam questions
items <- get_enem_itens(2023)

glimpse(items)
#> Rows: 5,550
#> Columns: 14
#> $ co_posicao       <chr> "21", "20", "11", ...
#> $ sg_area          <chr> "LC", "LC", "LC", ...
#> $ co_item          <chr> "141283", "118144", ...
#> $ tx_gabarito      <chr> "B", "C", "D", ...
#> $ co_habilidade    <chr> "14", "23", "26", ...
#> $ in_item_aban     <dbl> 0, 0, 0, ...
#> $ nu_param_a       <dbl> 2.20, 2.43, 1.95, ...
#> $ nu_param_b       <dbl> 0.83, 0.90, -0.13, ...
#> $ nu_param_c       <dbl> 0.21, 0.13, 0.20, ...
#> $ tx_cor           <chr> "AMARELA", "AMARELA", ...
#> $ co_prova         <chr> "1286", "1286", ...
#> # ... 3 more variables
School Census
The School Census is Brazil’s main statistical survey on basic education, covering all public and private schools.
Downloading Census data
# School data
schools_2023 <- get_censo_escolar(2023)

# Filter by state (faster)
schools_sp <- get_censo_escolar(2023, uf = "SP")

# Sample for exploration
schools_sample <- get_censo_escolar(2023, n_max = 1000)
Data structure
# The census contains over 400 variables per school!
glimpse(schools_2023)
#> Rows: 217,625
#> Columns: 408
#> $ nu_ano_censo <dbl> 2023, 2023, ...
#> $ no_regiao <chr> "Norte", "Norte", ...
#> $ co_regiao <chr> "1", "1", ...
#> $ no_uf <chr> "Rondônia", "Rondônia", ...
#> $ sg_uf <chr> "RO", "RO", ...
#> $ co_uf <chr> "11", "11", ...
#> $ no_municipio <chr> "Porto Velho", "Porto Velho", ...
#> $ co_municipio <chr> "1100205", "1100205", ...
#> $ no_regiao_geog_interm <chr> "Porto Velho", "Porto Velho", ...
#> $ co_regiao_geog_interm <chr> "1101", "1101", ...
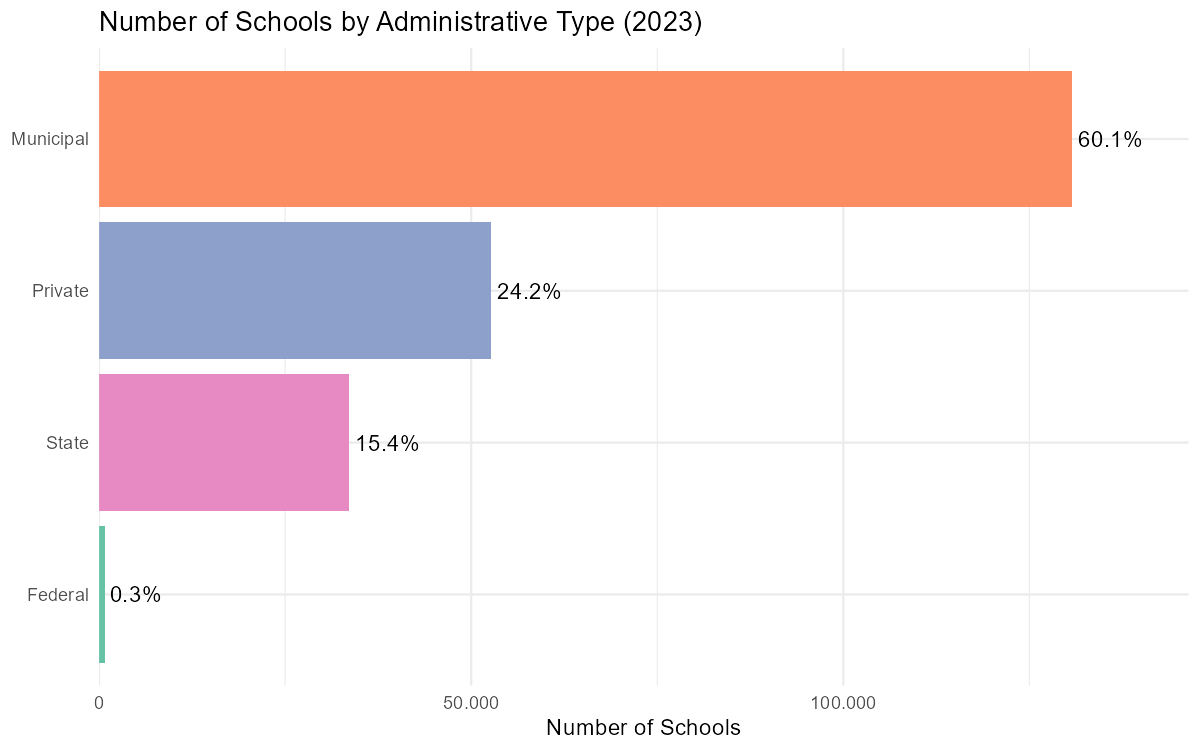
#> # ... 398 more variablesAnalysis: Schools by administrative type
# Count by administrative type
schools_by_type <-
  schools_2023 |>
  mutate(
    admin_type = case_when(
      tp_dependencia == 1 ~ "Federal",
      tp_dependencia == 2 ~ "State",
      tp_dependencia == 3 ~ "Municipal",
      tp_dependencia == 4 ~ "Private"
    )
  ) |>
  count(admin_type) |>
  mutate(pct = n / sum(n) * 100)

ggplot(schools_by_type, aes(x = reorder(admin_type, n), y = n, fill = admin_type)) +
  geom_col() +
  geom_text(aes(label = sprintf("%.1f%%", pct)), hjust = -0.1) +
  coord_flip() +
  scale_fill_brewer(palette = "Set2") +
  labs(
    title = "Number of Schools by Administrative Type (2023)",
    x     = NULL,
    y     = "Number of Schools"
  ) +
  theme_minimal() +
  theme(legend.position = "none") +
  scale_y_continuous(
    labels = scales::label_number(big.mark = ".", decimal.mark = ","),
    expand = expansion(mult = c(0, 0.12))
  )
Analysis: School infrastructure
# Check infrastructure availability in public schools
infra <-
  schools_2023 |>
  filter(tp_dependencia %in% c(2, 3)) |>  # Public schools only
  summarise(
    pct_internet      = mean(in_internet == 1, na.rm = TRUE) * 100,
    pct_library       = mean(in_biblioteca == 1, na.rm = TRUE) * 100,
    pct_computer_lab  = mean(in_laboratorio_informatica == 1, na.rm = TRUE) * 100,
    pct_sports_court  = mean(in_quadra_esportes == 1, na.rm = TRUE) * 100,
    pct_ramps         = mean(in_acessibilidade_rampas == 1, na.rm = TRUE) * 100
  )

print(infra)| Internet | Library | Computer Lab | Sports Court | Ramps |
|---|---|---|---|---|
| 88.5 | 31.2 | 29.3 | 36 | 53.5 |
Best practices
1. Set a permanent cache
# At the start of each project
set_cache_dir("~/educabR_data")
2. Use samples for exploration
# Explore with a small sample first
test_data <- get_enem(2023, n_max = 1000)

# Then download the full data
# full_data <- get_enem(2023)4. Monitor memory usage
# Large files can consume a lot of RAM
# Use n_max or filter data after loading
data <- get_censo_escolar(2023)
data_filtered <-
  data |>
  select(co_entidade, no_entidade, sg_uf, tp_dependencia)
rm(data)  # Free memory
gc()
Data dictionary
For detailed information about variables, see the official documentation:
- IDEB: https://www.gov.br/inep/pt-br/areas-de-atuacao/pesquisas-estatisticas-e-indicadores/ideb
- ENEM: https://www.gov.br/inep/pt-br/acesso-a-informacao/dados-abertos/microdados/enem
- School Census: https://www.gov.br/inep/pt-br/acesso-a-informacao/dados-abertos/microdados/censo-escolar
- SAEB: https://www.gov.br/inep/pt-br/acesso-a-informacao/dados-abertos/microdados/saeb
- ENADE: https://www.gov.br/inep/pt-br/acesso-a-informacao/dados-abertos/microdados/enade
- CAPES: https://dadosabertos.capes.gov.br
-
FUNDEB/FNDE:
https://www.fnde.gov.br
Known issues
- Slow downloads: INEP servers can be slow. The package retries automatically up to 3 times.
-
Large files: ENEM and School Census files can be
several GB. Use
n_maxfor testing. - Encoding: Some files have encoding issues. The package handles this automatically.
Contributing
Found a bug or want to suggest improvements? Open an issue on GitHub: https://github.com/SidneyBissoli/educabR/issues